Knowing your system
System Characteristics
Understanding the system code will be run on is an important step to developing and running R code efficiently.
There are a number of ways to explore your system from within R.
sessionInfo
The easiest place to start would be with function sessionInfo() which prints version information about R, the OS and attached or loaded packages.
Here’s the output of sessionInfo() on my laptop:
R version 4.2.1 (2022-06-23)
Platform: aarch64-apple-darwin21.6.0 (64-bit)
Running under: macOS Monterey 12.3.1

Matrix products: default
BLAS:   /opt/homebrew/Cellar/openblas/0.3.21/lib/libopenblasp-r0.3.21.dylib
LAPACK: /opt/homebrew/Cellar/r/4.2.1_4/lib/R/lib/libRlapack.dylib

locale:
[1] en_GB.UTF-8/en_GB.UTF-8/en_GB.UTF-8/C/en_GB.UTF-8/en_GB.UTF-8

attached base packages:
[1] stats     graphics  grDevices datasets  utils     methods   base

loaded via a namespace (and not attached):
[1] compiler_4.2.1 tools_4.2.1    renv_0.15.5
Apart from information about packages loaded in the current R session, the function also prints some software information including like the Platform and OS version, the Linear Libraries R is using and locale.
Note that sessionInfo() displays information about the software environment in your current R session.
But the hardware R is running on is also important to assessing what performance you might be able to achieve and the strategies you might consider to achieve better performance.
benchmarkme 📦
benchmarkme is a nifty R package you can use to both access information about both hardware and software available to R on your system as well as functionality to benchmark your system using benchmarks for numerical operations as well as for benchmarking I/O.
Let’s use the library to first explore our system.
The package contains a suite of functions for accessing information about your systems hardware and software relevant to R.
RAM:
get_ram()CPUs:
get_cpu()BLAS library:
get_linear_algebra()Is byte compiling enabled:
get_byte_compiler()General platform info:
get_platform_info()R version:
get_r_version()
get_ram()34.4 GBget_cpu()$vendor_id
character(0)
$model_name
[1] "Apple M1 Pro"
$no_of_cores
[1] 10$blas
[1] "/Library/Frameworks/R.framework/Versions/4.2-arm64/Resources/lib/libRblas.0.dylib"
$lapack
[1] "/Library/Frameworks/R.framework/Versions/4.2-arm64/Resources/lib/libRlapack.dylib"byte_optimize
2 $OS.type
[1] "unix"
$file.sep
[1] "/"
$dynlib.ext
[1] ".so"
$GUI
[1] "X11"
$endian
[1] "little"
$pkgType
[1] "mac.binary.big-sur-arm64"
$path.sep
[1] ":"
$r_arch
[1] ""$platform
[1] "aarch64-apple-darwin20"
$arch
[1] "aarch64"
$os
[1] "darwin20"
$system
[1] "aarch64, darwin20"
$status
[1] ""
$major
[1] "4"
$minor
[1] "2.1"
$year
[1] "2022"
$month
[1] "06"
$day
[1] "23"
$`svn rev`
[1] "82513"
$language
[1] "R"
$version.string
[1] "R version 4.2.1 (2022-06-23)"
$nickname
[1] "Funny-Looking Kid"Note that the BLAS linear library shown here is libRblas whereas the previous output which I got by running session info through R in the terminal showed that R was using openblas. This is a consequence of running R through RStudio on M1 Macs and will hopefully be rectified at some point.
Monitoring your system
All operating systems have dedicated system activity monitors, available through a GUI or through the terminal.
GUIs
Let’s explore what’s currently going on on our systems through our OS’s dedicated GUI.
Depending on your OS,
macOS: Activity Monitor
Windows: Task Manager ([How to Open Task Manager in Windows 10](https://www.freecodecamp.org/news/how-to-open-task-manager-in-windows-10/))
Linux: GNOME System Monitor
Here’s what Activity Monitor looks like on my Mac.
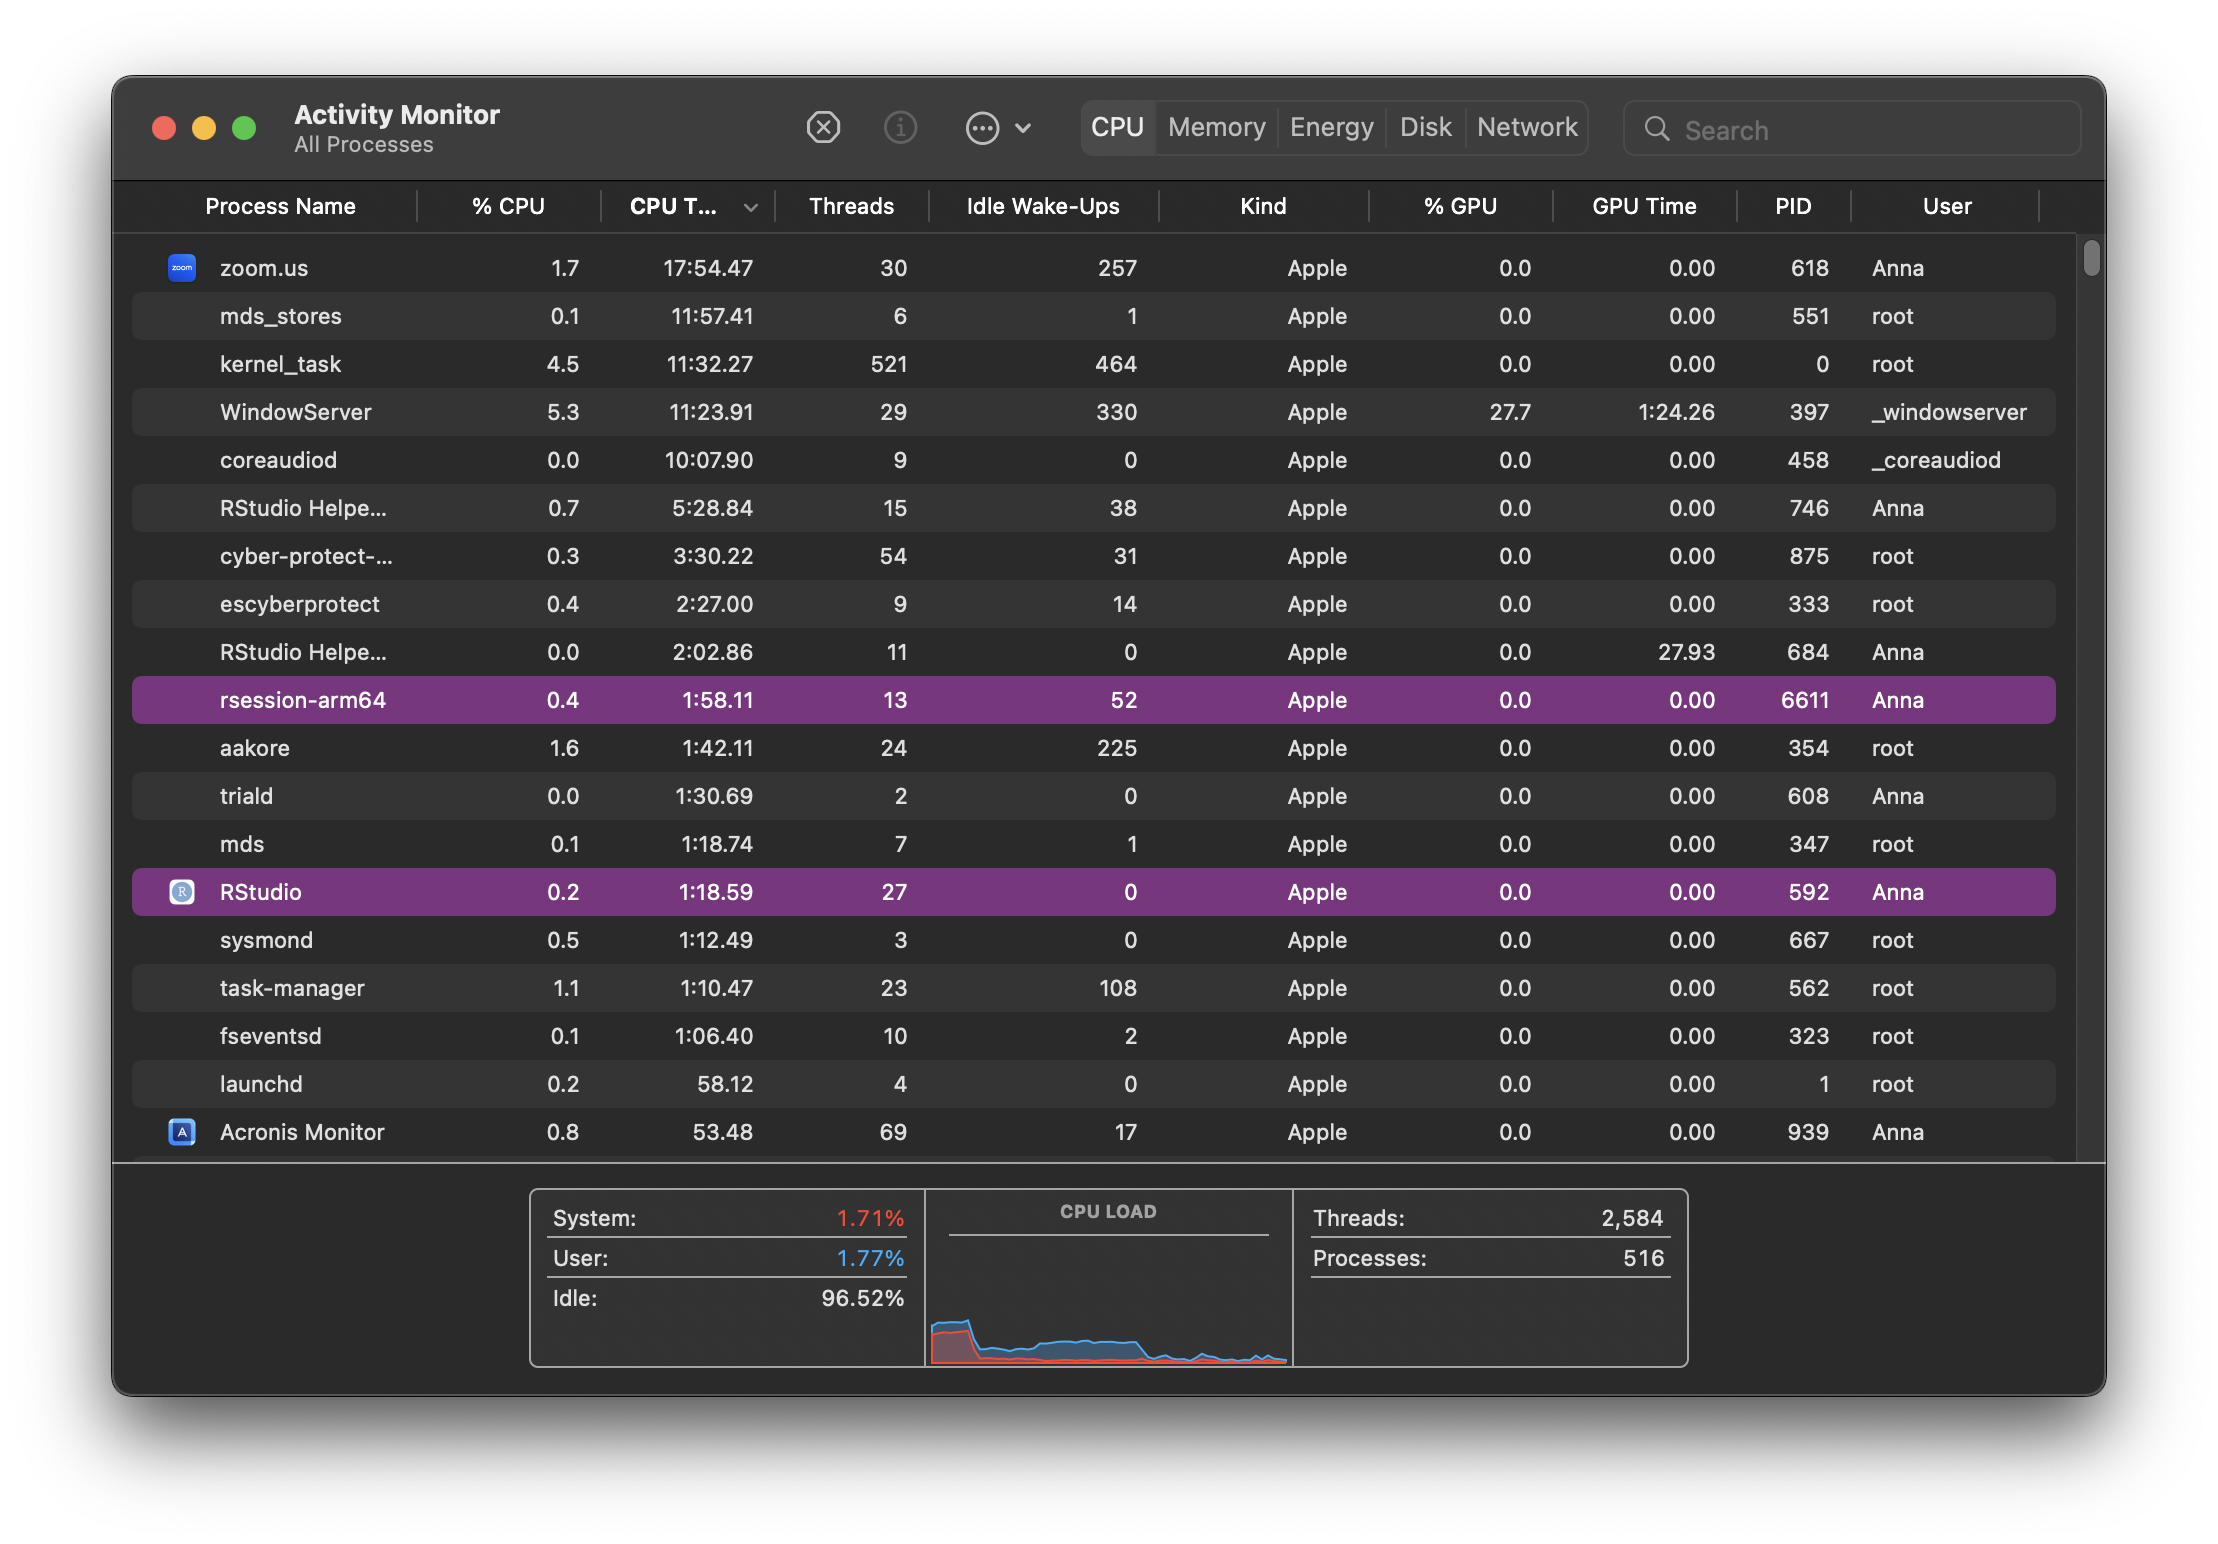
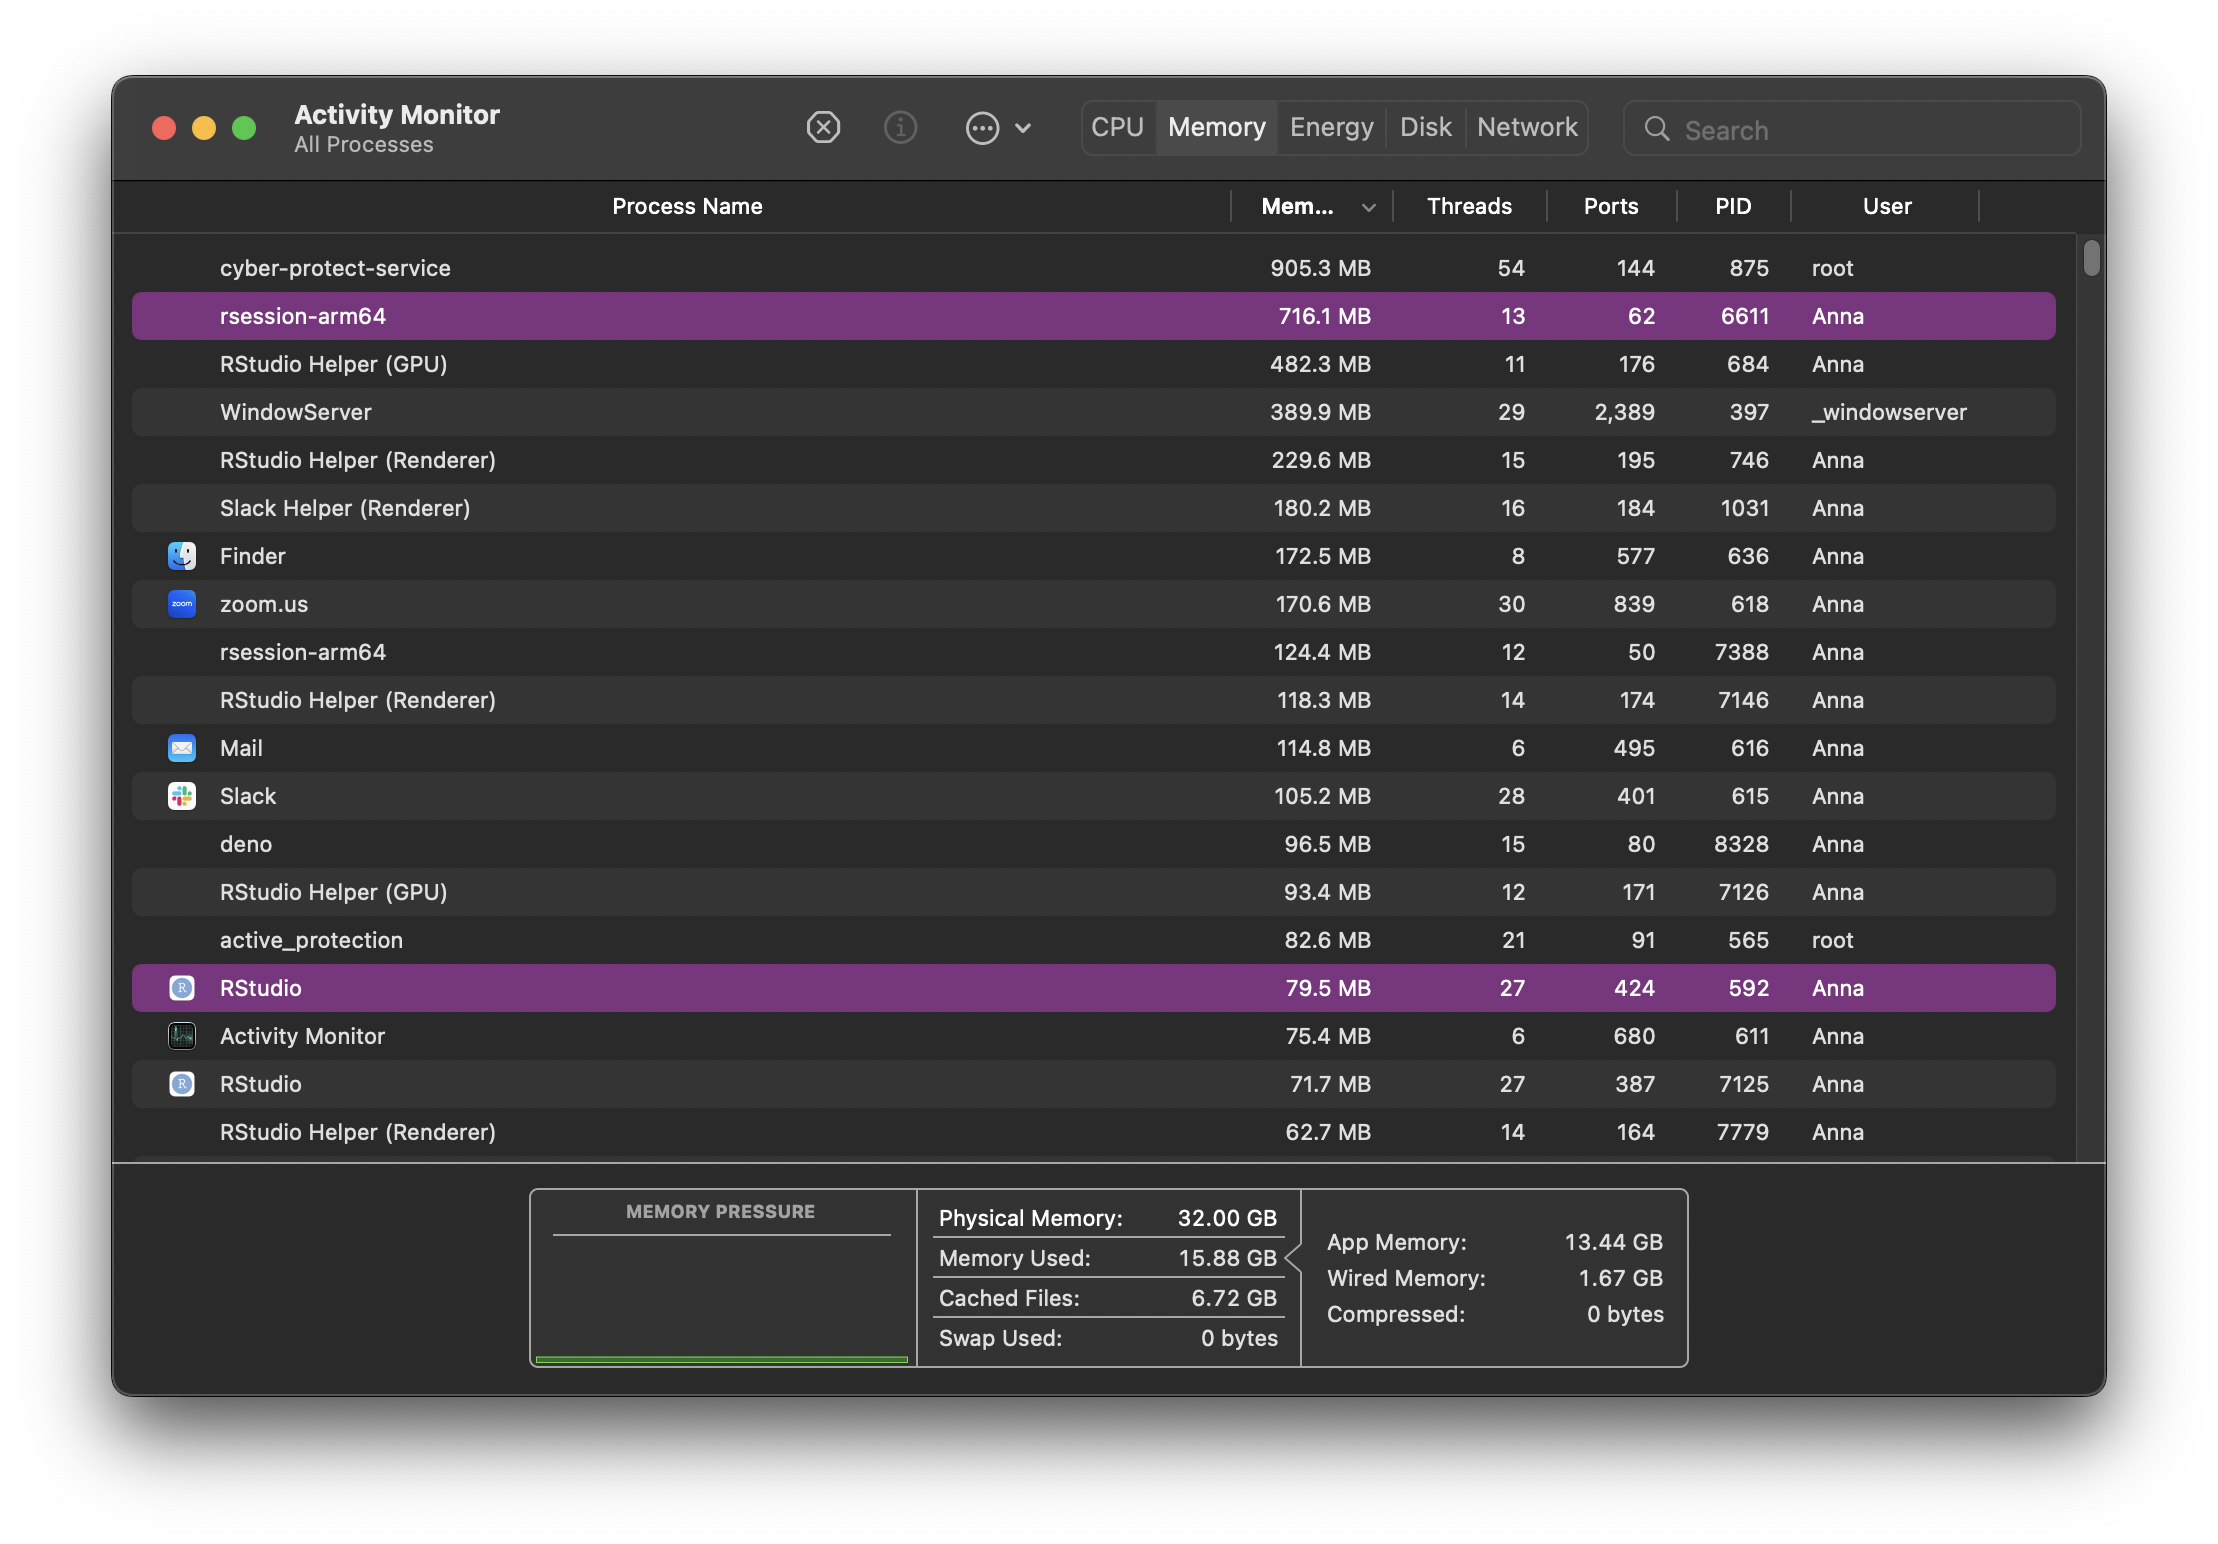
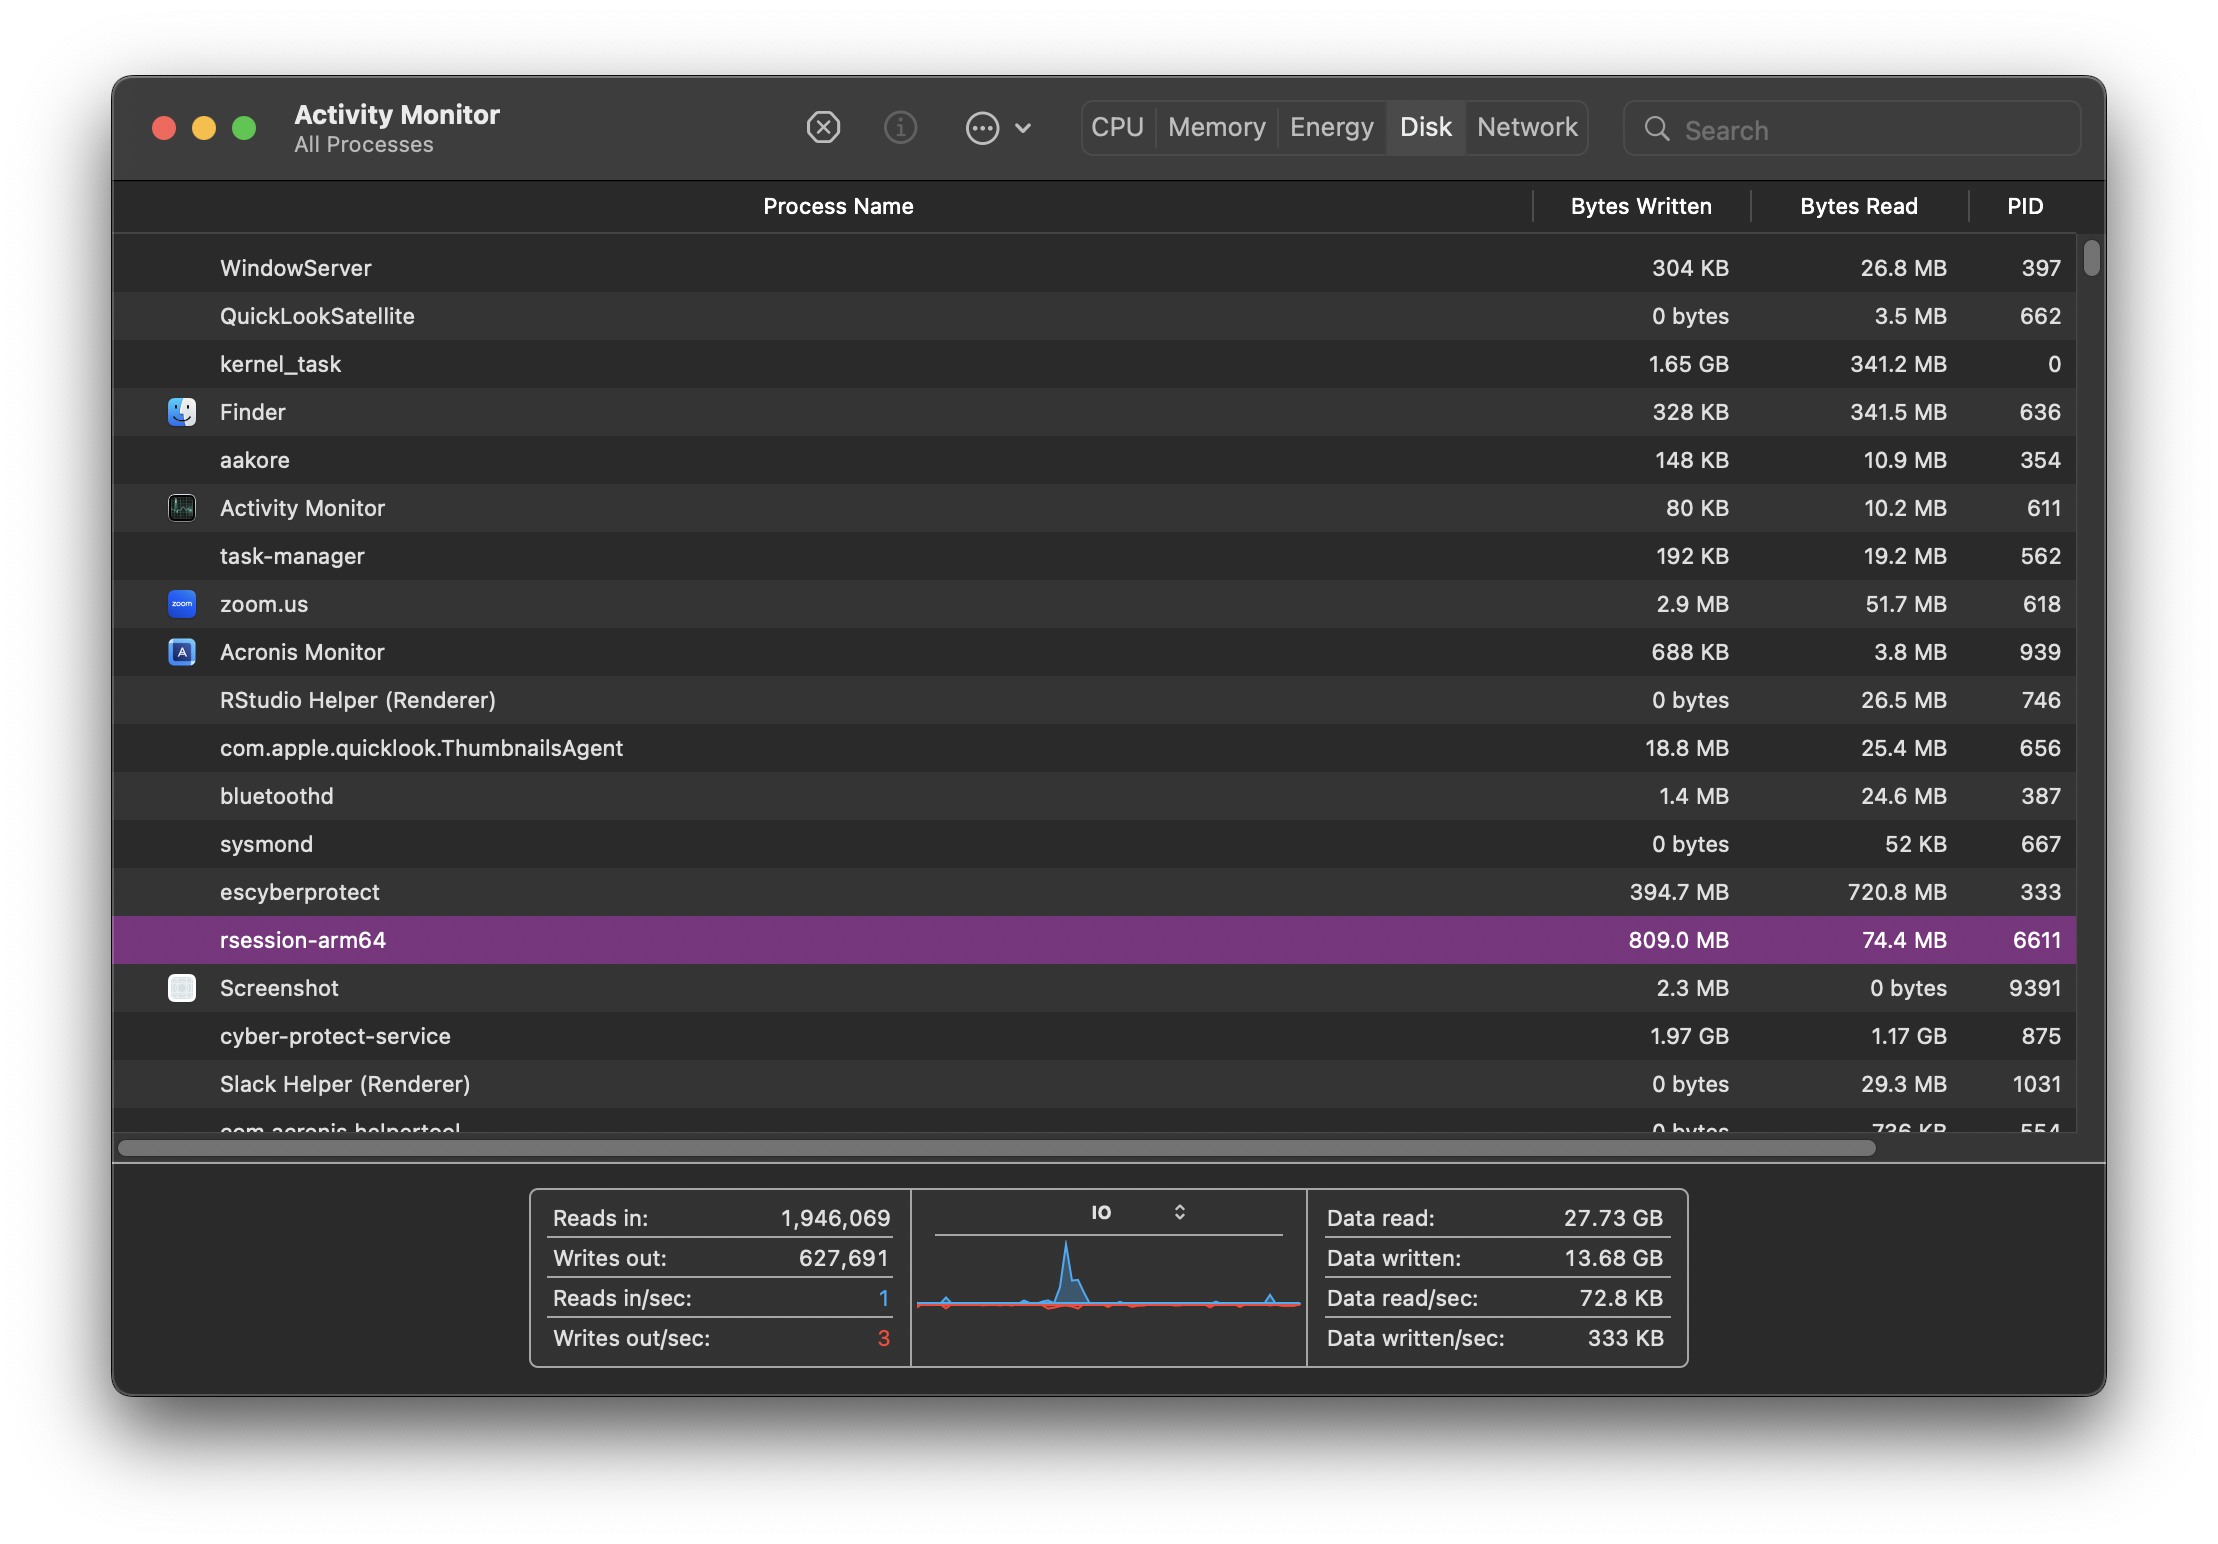
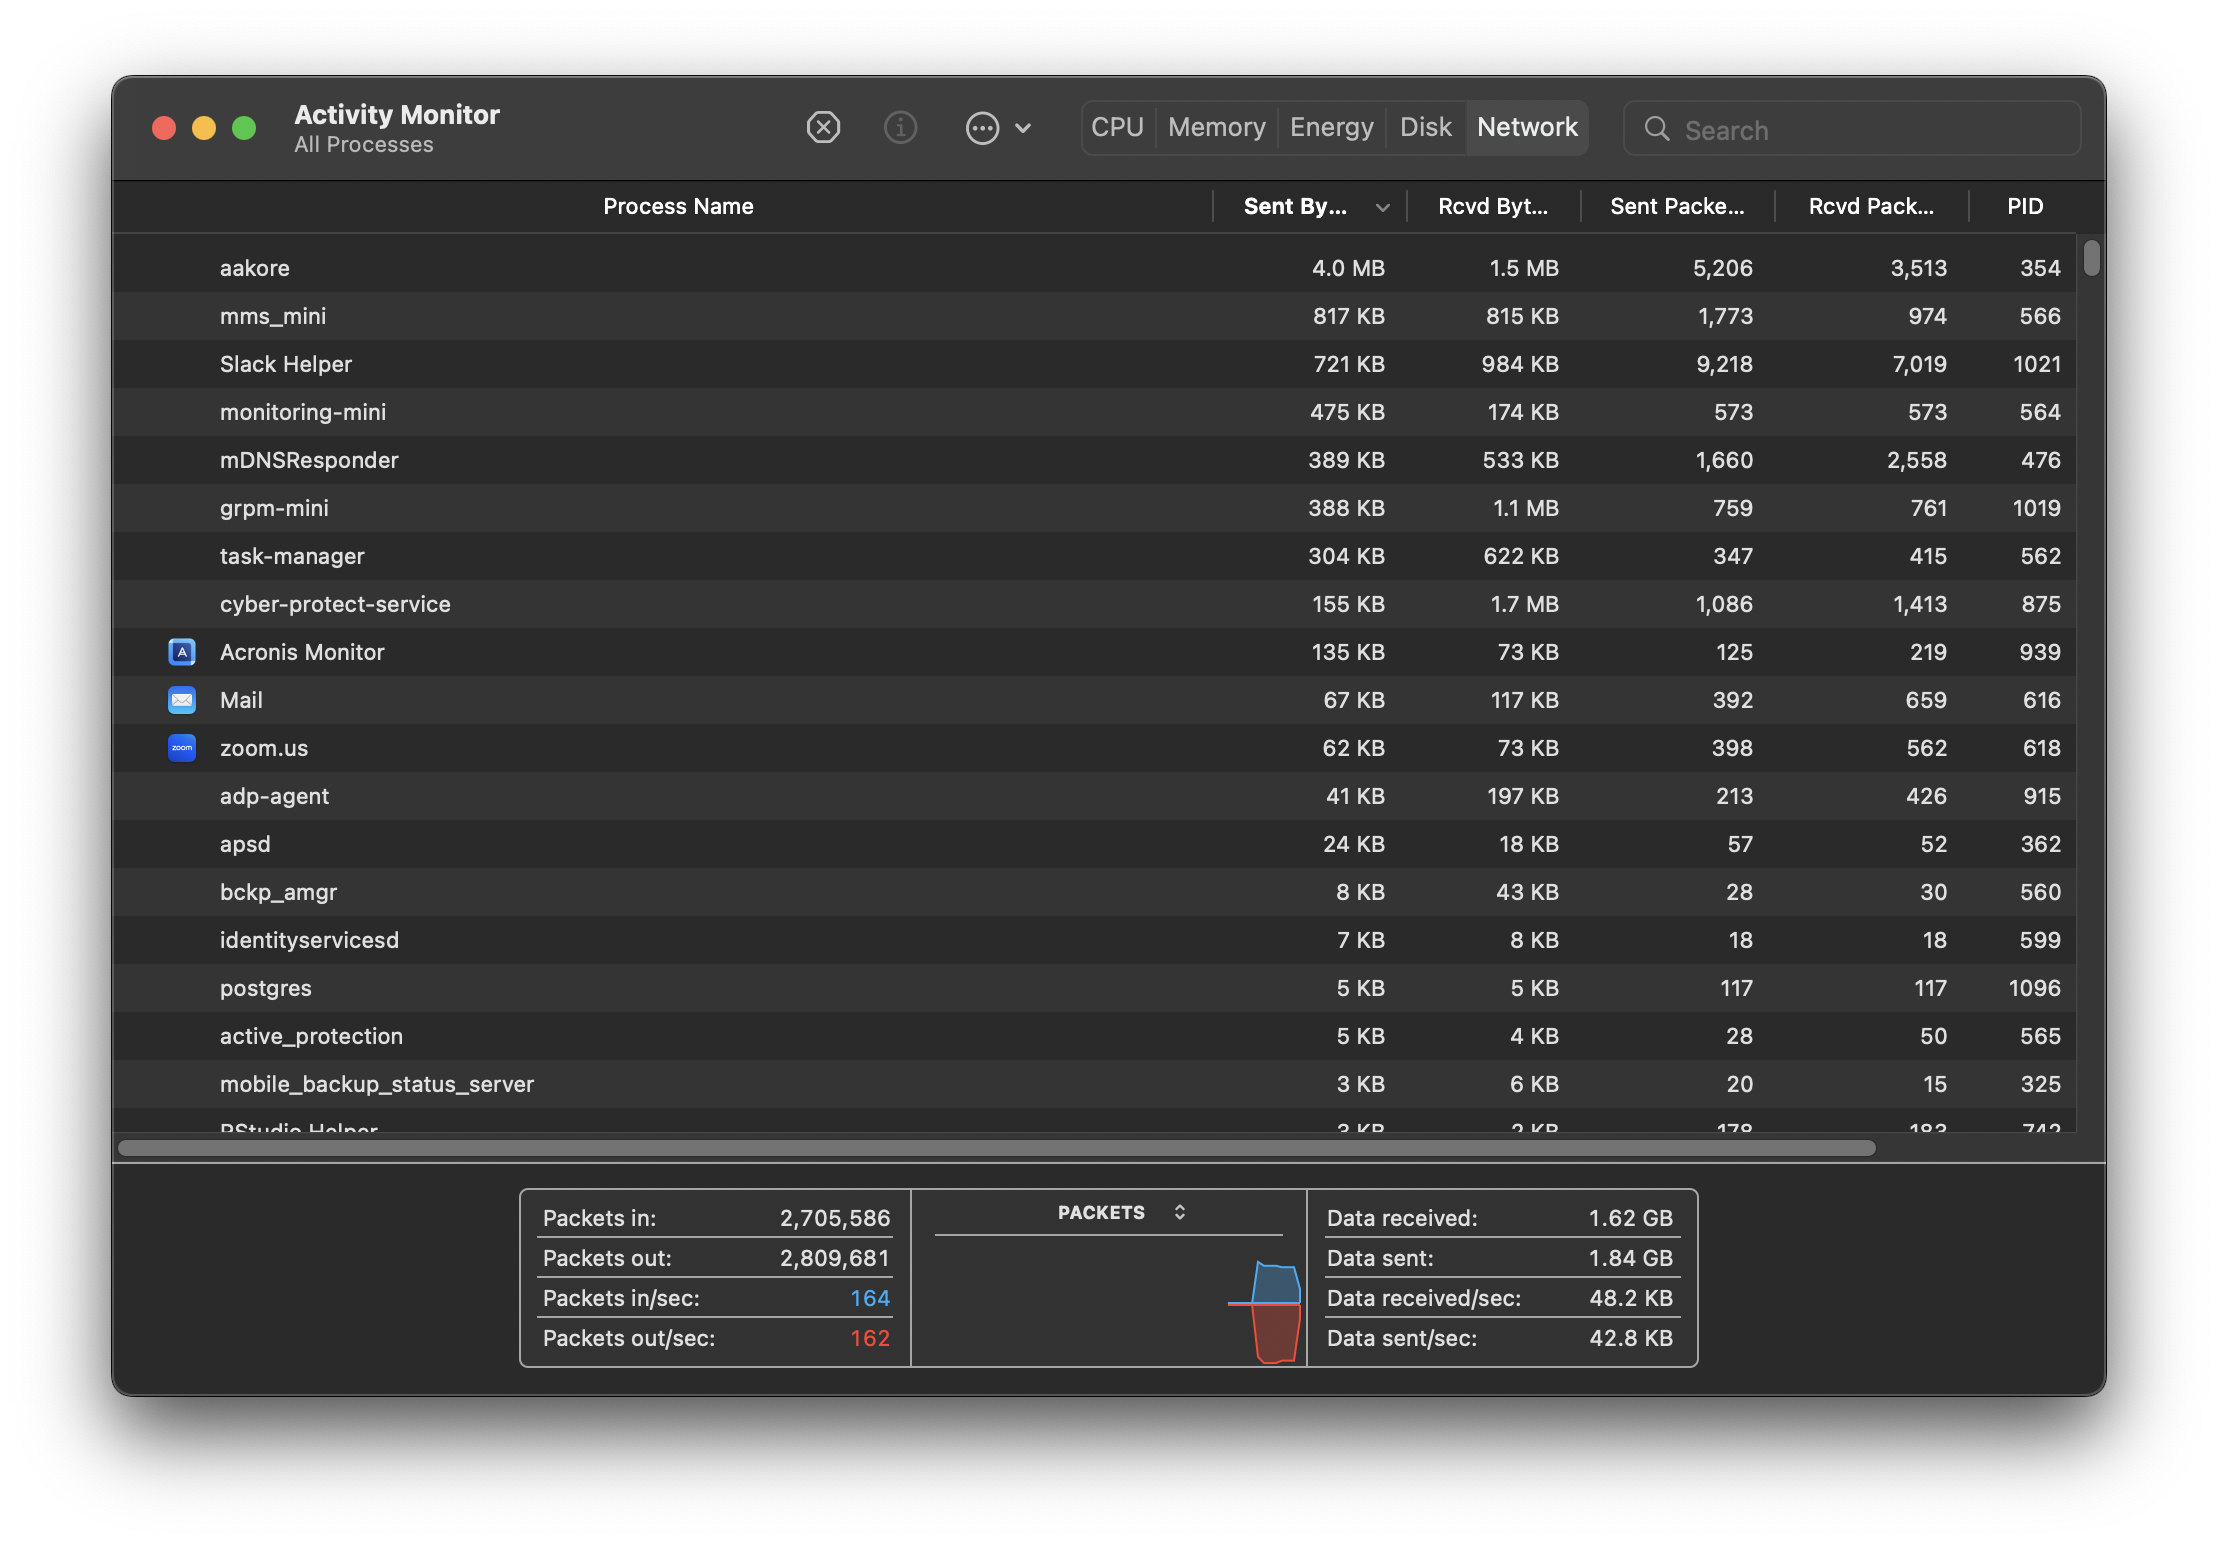
CPU, Memory, Disk and Network monitoring is split across tabs but your monitor might show everything in the same tab across different graphs. Some terminology and information shown might differ but ultimately, all monitors attempt to show an overview of similar system activity.
Each row in the monitor table of activities represents a process, each process having its own PID (process ID). They are all controlled by the kernel. As new processes are initiated (for example when we open a new application), the kernel creates a new process for it. If there are multiple cores available on your system, the kernel will allocate new processes to inactive cores. When more processes than cores are running, the kernel uses context switching to keep multiple processes running on a single core.
Terminal
top
On macOS and Linux distributions, the top command can also be run in the terminal which initiates system monitoring in the terminal. top shows a summary of system activity as well as periodically displaying a list of processes on the system in sorted order. The default key for sorting is pid, but other keys can be used instead.
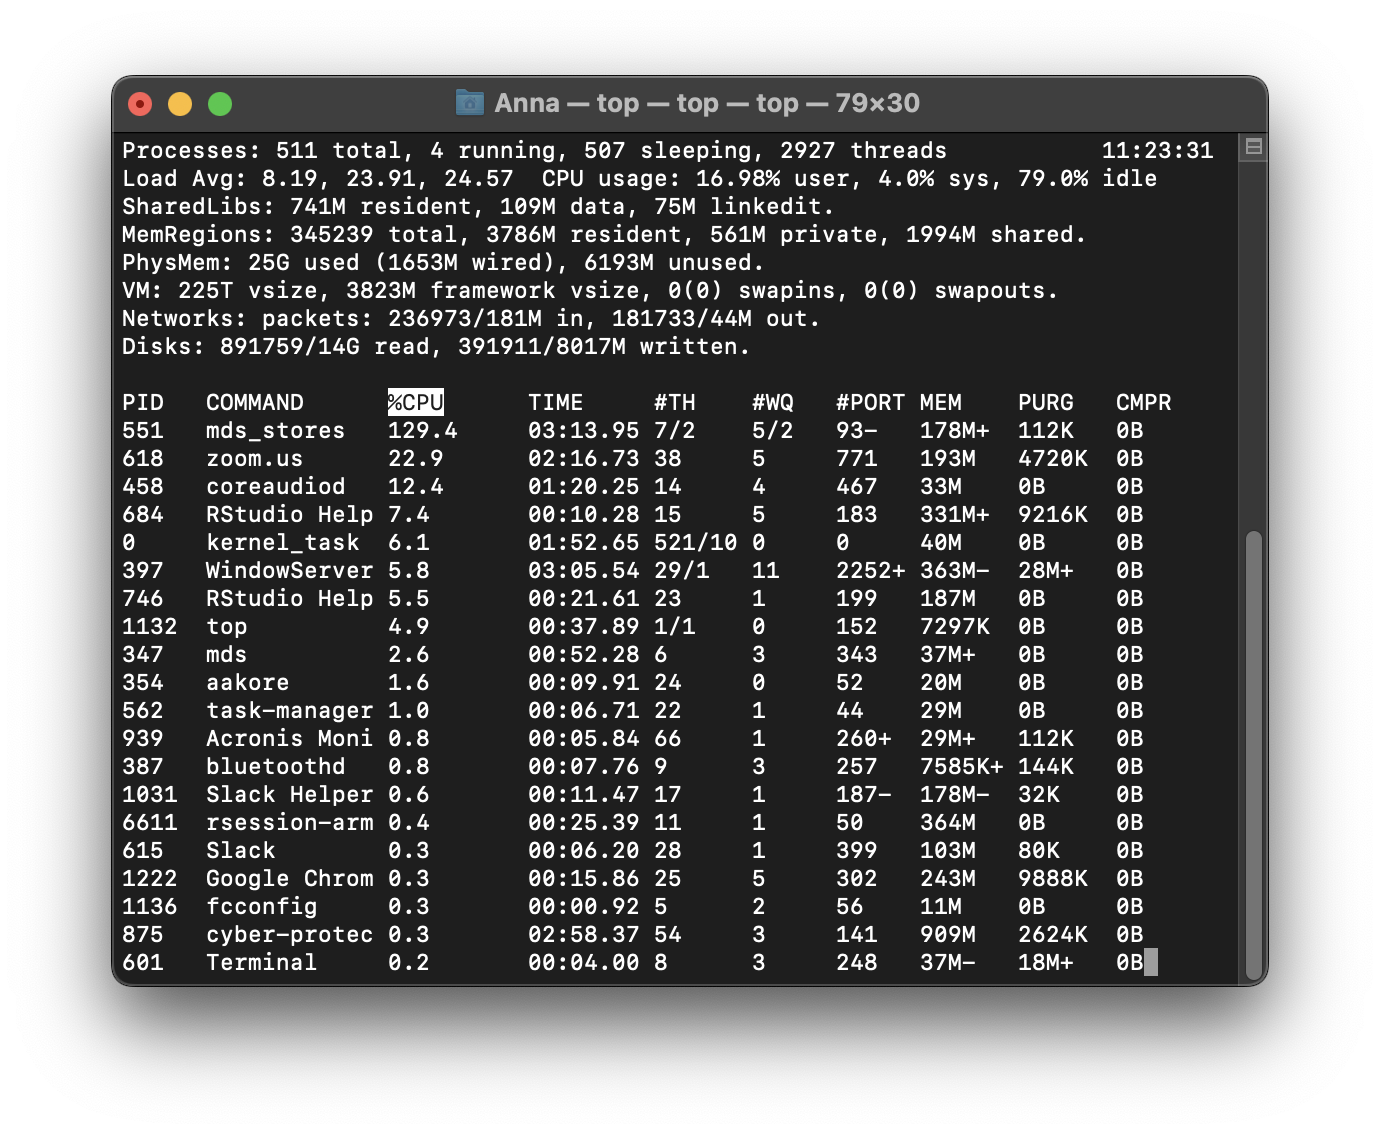
Example of Activity monitoring when running R
Let’s run the following matrix multiplication code on our system and observe what happens on our system monitor.
This is what happens when monitoring through top. The rsession process moves to the top and, running in a single thread, uses ~100% of the available CPU while running. When finished, the process drops from the top and goes back to using just 0.2% of CPU as R waits for our next command.
Benchmarking your system
As afforementioned, the benchmarkme package provides a set of benchmarks to help quantify your system. More interestingly, it allows you to compare your timings with timings crowdsourced on other systems.
There are two groups of benchmarks:
benchmark_std(): this benchmarks numerical operations such as loops and matrix operations. The benchmark comprises of three separate benchmarks:prog,matrix_fun, andmatrix_cal.benchmark_io(): this benchmarks reading and writing a 5 / 50, MB csv file.
You can compare your results to other users by assigning the output of the benchmarking to a variable and plotting it.
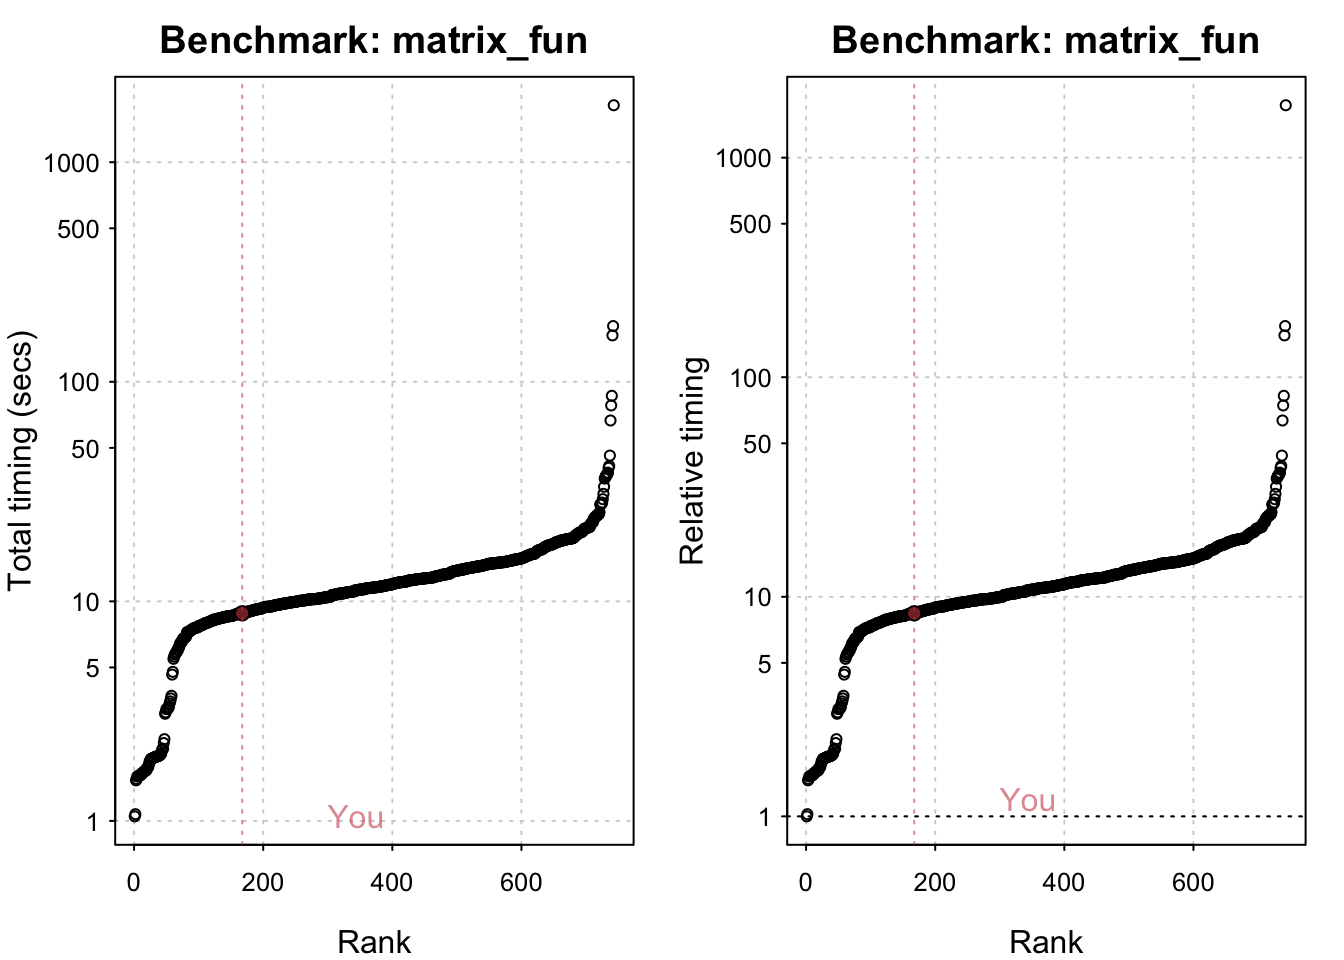
std_bm <- benchmark_std()# Programming benchmarks (5 tests): 3,500,000 Fibonacci numbers calculation (vector calc): 0.0937 (sec). Grand common divisors of 1,000,000 pairs (recursion): 0.202 (sec). Creation of a 3,500 x 3,500 Hilbert matrix (matrix calc): 0.114 (sec). Creation of a 3,000 x 3,000 Toeplitz matrix (loops): 0.574 (sec). Escoufier's method on a 60 x 60 matrix (mixed): 0.536 (sec).# Matrix calculation benchmarks (5 tests): Creation, transp., deformation of a 5,000 x 5,000 matrix: 0.195 (sec). 2,500 x 2,500 normal distributed random matrix^1,000: 0.112 (sec). Sorting of 7,000,000 random values: 0.6 (sec). 2,500 x 2,500 cross-product matrix (b = a' * a): 9.41 (sec). Linear regr. over a 5,000 x 500 matrix (c = a \ b'): 0.788 (sec).# Matrix function benchmarks (5 tests): Cholesky decomposition of a 3,000 x 3,000 matrix: 5.14 (sec). Determinant of a 2,500 x 2,500 random matrix: 1.75 (sec). Eigenvalues of a 640 x 640 random matrix: 0.423 (sec). FFT over 2,500,000 random values: 0.086 (sec). Inverse of a 1,600 x 1,600 random matrix: 1.42 (sec).plot(std_bm)You are ranked 1 out of 749 machines.Press return to get next plot You are ranked 287 out of 747 machines.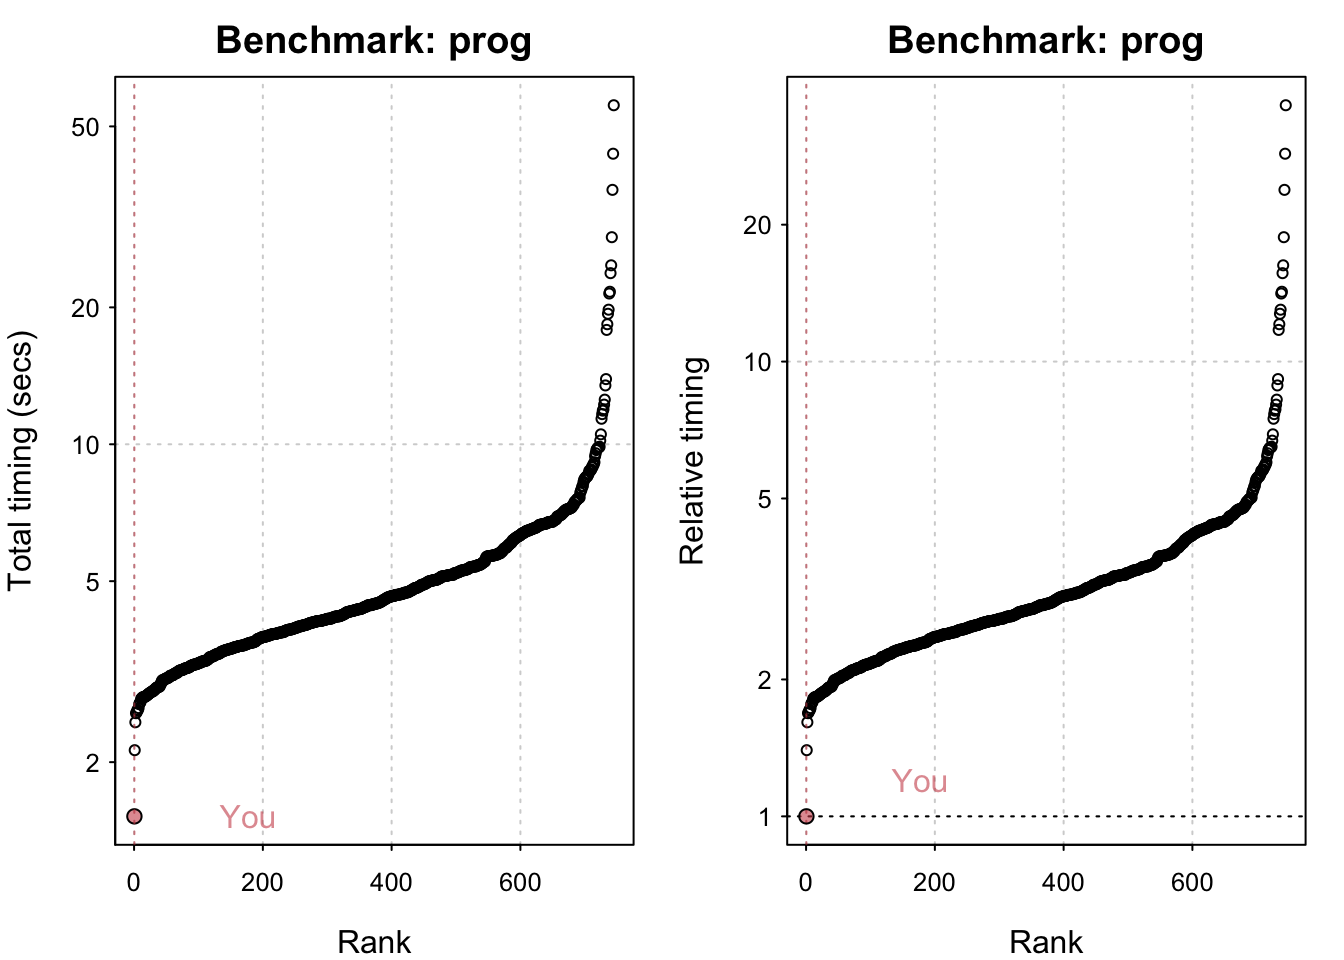
Press return to get next plot You are ranked 168 out of 747 machines.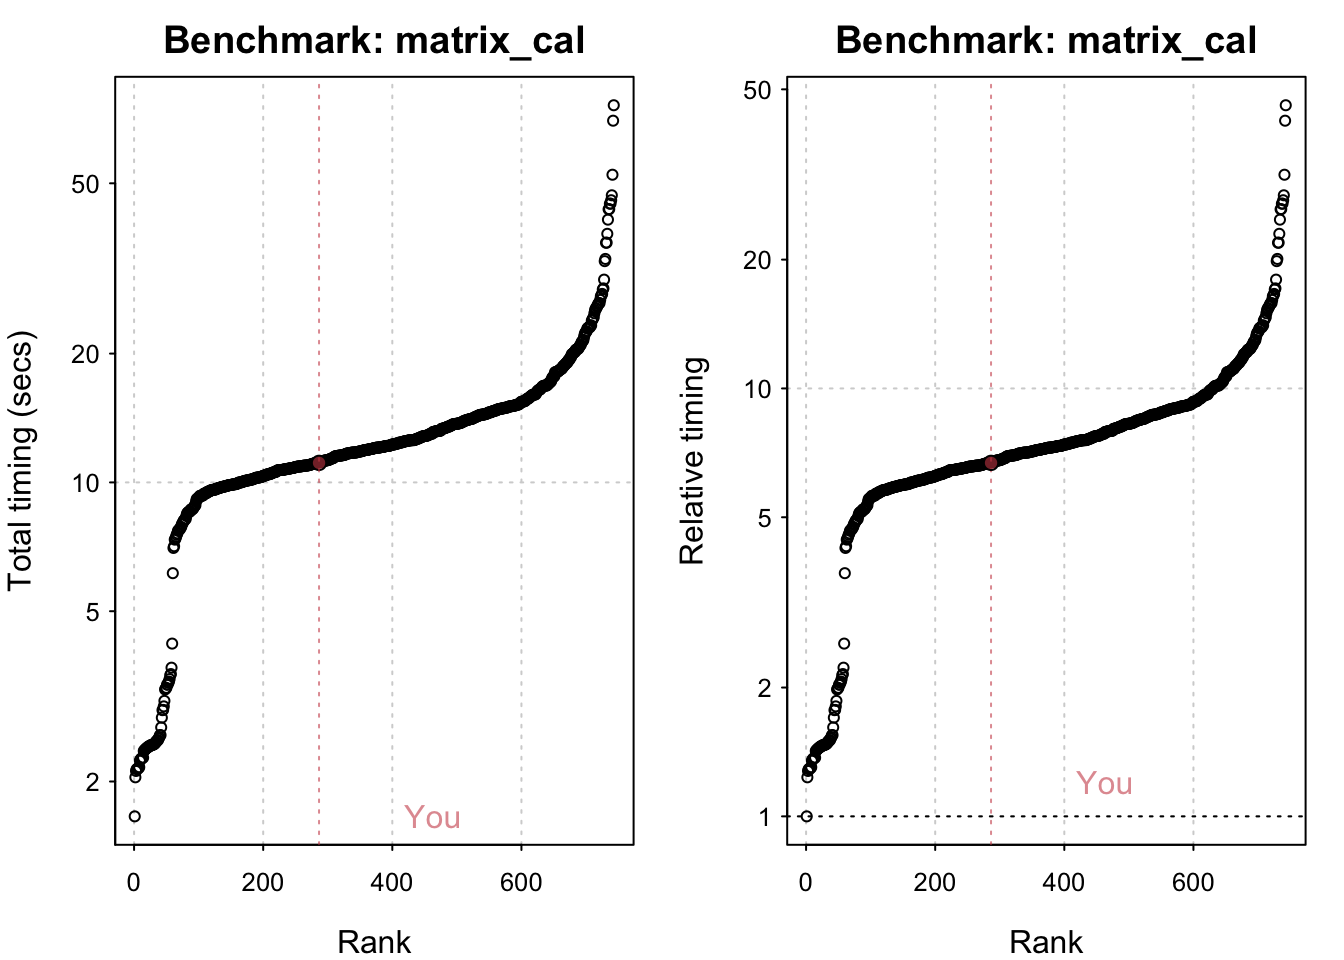
io_bm <- benchmark_io()Preparing read/write io# IO benchmarks (2 tests) for size 50 MB: Writing a csv with 6250000 values: 3.42 (sec). Writing a csv with 6250000 values: 3.4 (sec).
Writing a csv with 6250000 values: 3.4 (sec). Reading a csv with 6250000 values: 1.2 (sec). Reading a csv with 6250000 values: 1.19 (sec).
Reading a csv with 6250000 values: 1.19 (sec).# IO benchmarks (2 tests) for size 5 MB: Writing a csv with 625000 values: 0.346 (sec).
Writing a csv with 625000 values: 0.346 (sec).
Writing a csv with 625000 values: 0.346 (sec). Reading a csv with 625000 values: 0.118 (sec).
Reading a csv with 625000 values: 0.118 (sec).
Reading a csv with 625000 values: 0.118 (sec).plot(io_bm)You are ranked 1 out of 119 machines.Press return to get next plot You are ranked 1 out of 119 machines.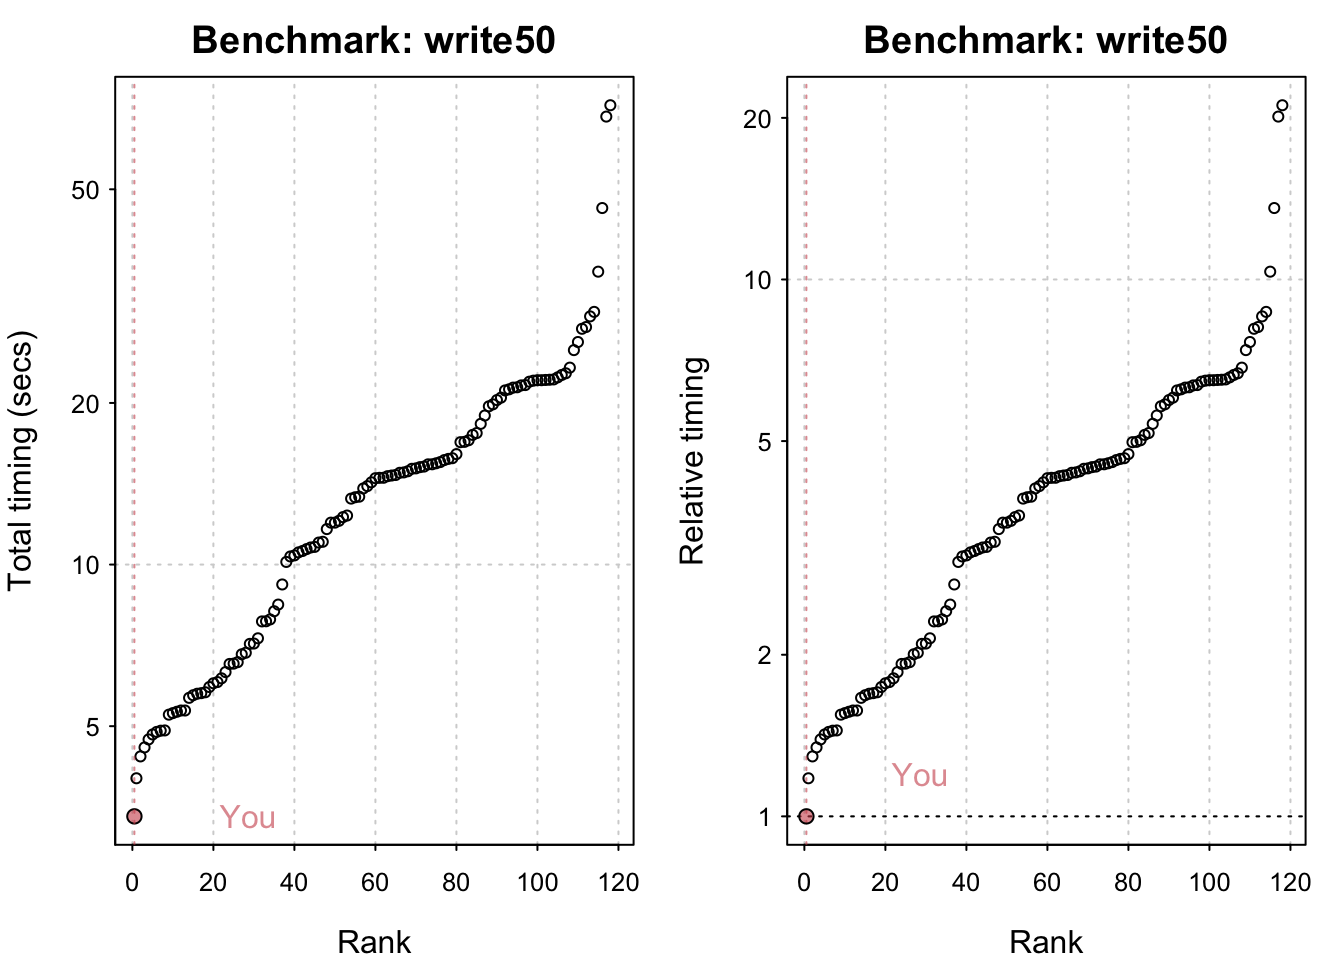
Press return to get next plot You are ranked 1 out of 135 machines.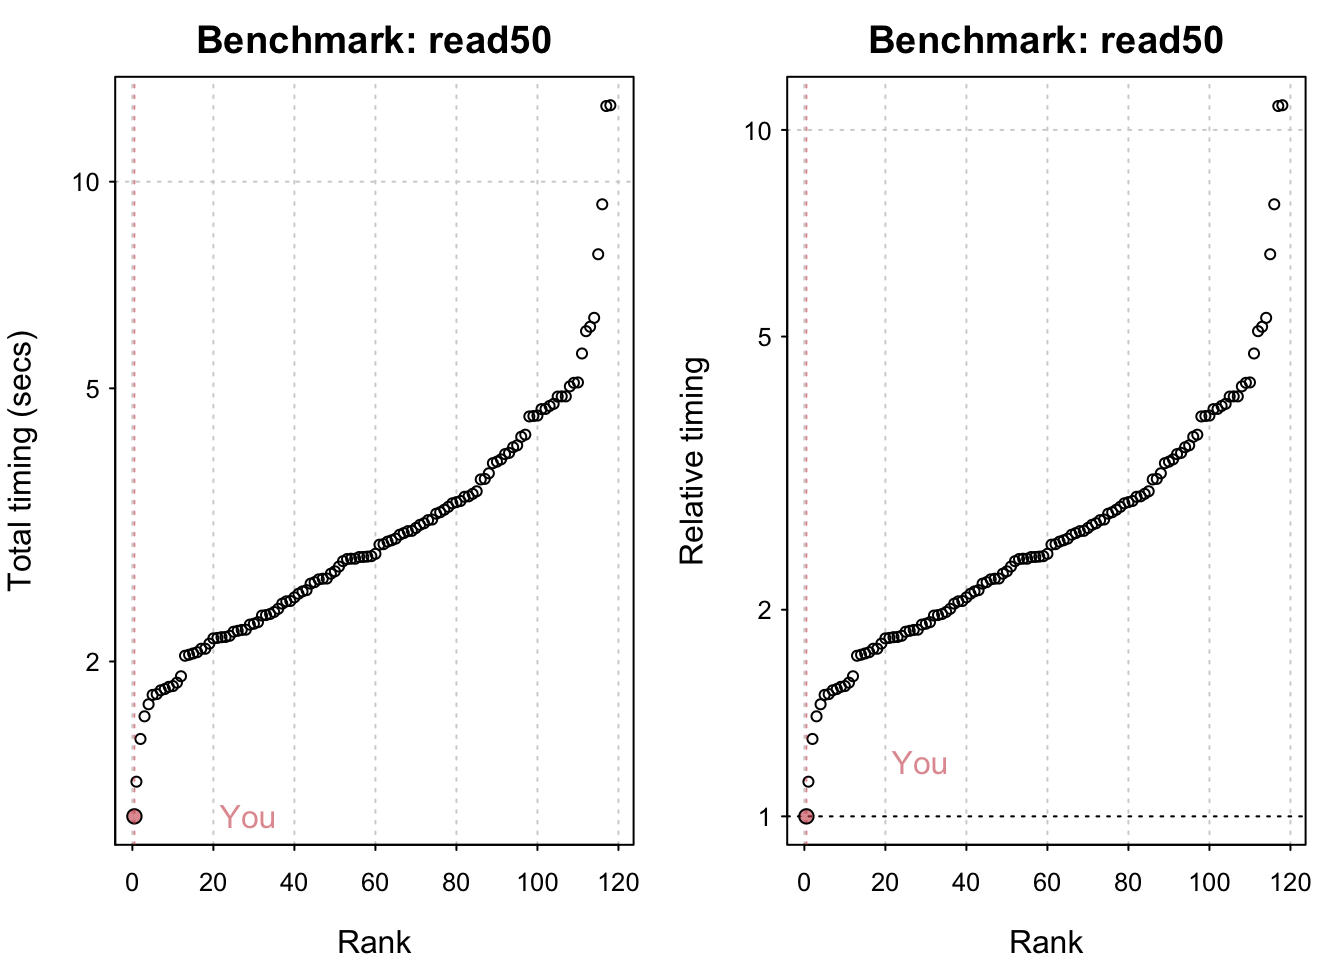
Press return to get next plot You are ranked 1 out of 135 machines.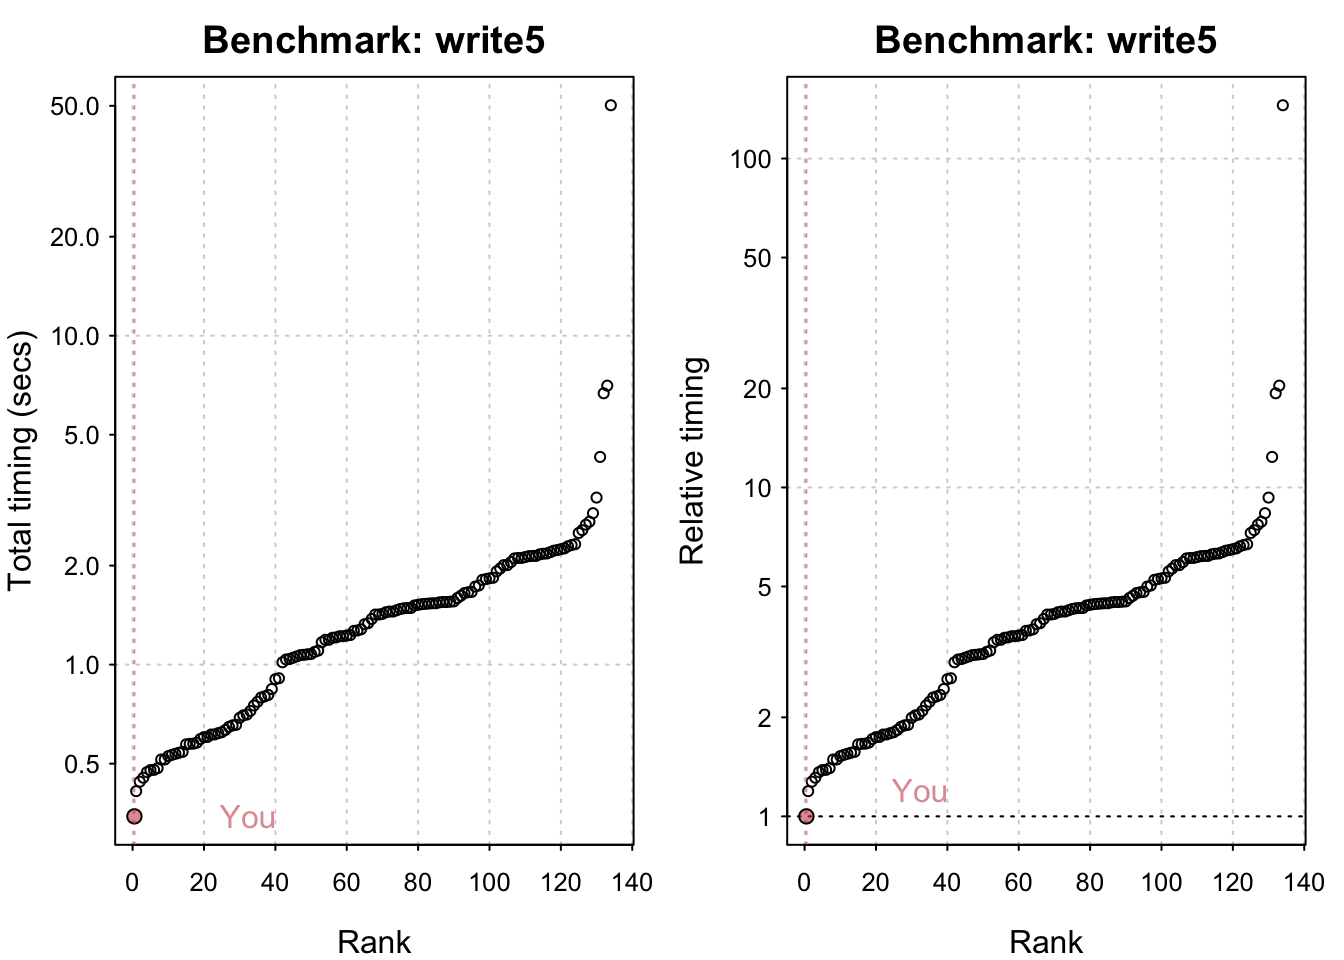
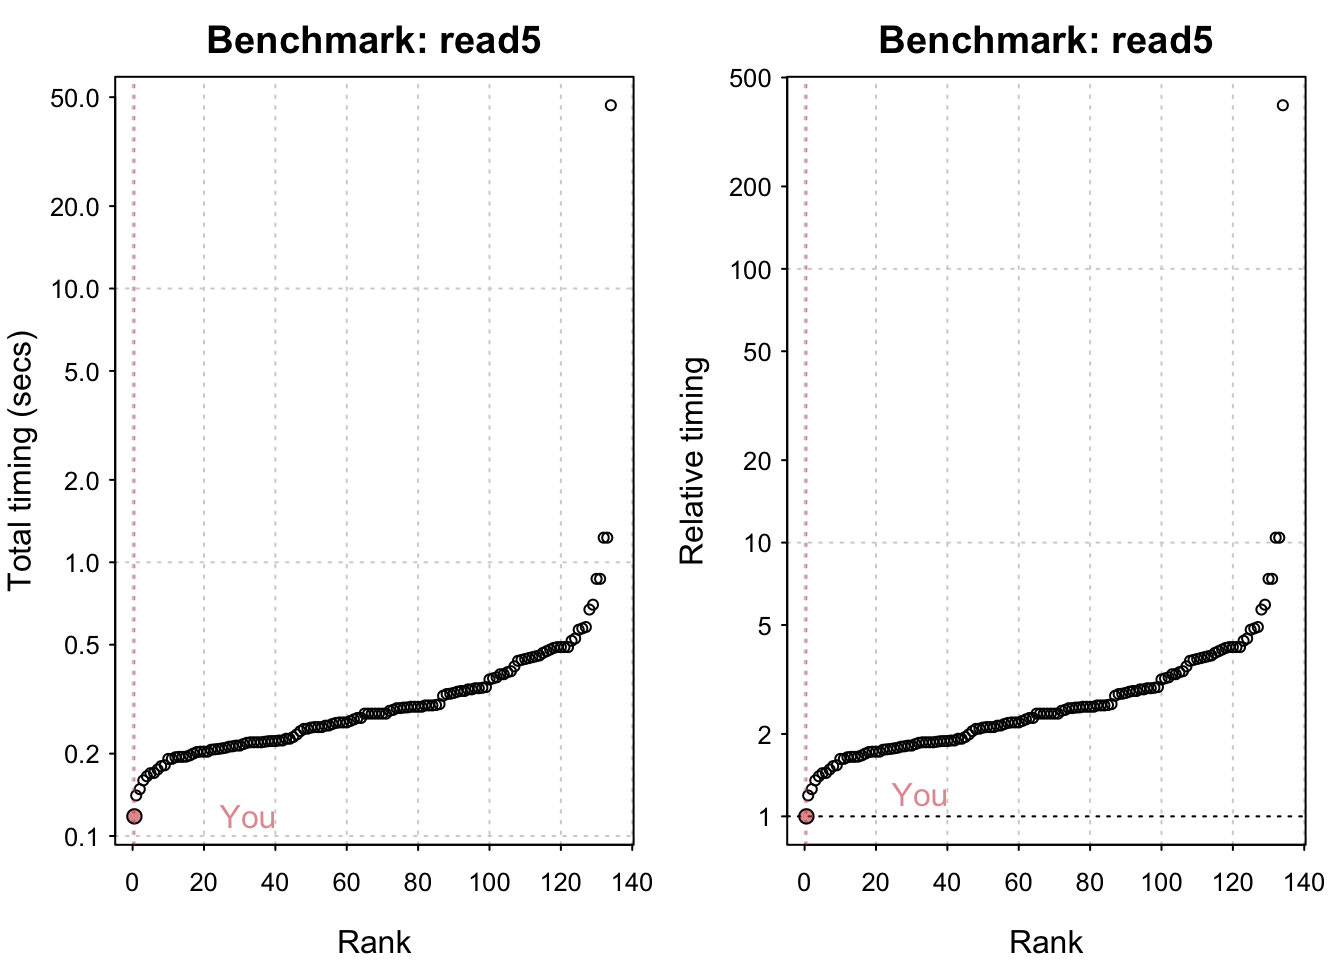
All in all my system seems comparatively fast! M1 chips have indeed been shown to be generally very performant. Having said that I seriously doubt I have the most powerful system out there and it’s likely that the timings it’s being compared to are somewhat out of date.